In Vivo Pharmacology Services at JAX performs efficacy studies using the spontaneous NOD/ShiLtJ (001976) and STZ-inducible Type 1 Diabetes mouse models.
LEARN MORE
Contact Us
[email protected]
1.800.422.6423 (US)
1.207.288.5845 (International)
Type 1 diabetes (T1D), also called insulin-dependent diabetes mellitus (IDDM), is characterized by the autoimmune destruction of pancreatic beta cells. As a result, patients produce inadequate amounts of insulin. In Vivo Pharmacology Services at JAX performs efficacy studies using the spontaneous NOD/ShiLtJ (001976) and STZ-inducible Type 1 Diabetes mouse models.
| Phenotype | STZ Model C57BL/6J (JR# 000664) Inducible |
NOD/ShiLtJ (JR# 001976) Spontaneous |
Method |
|---|---|---|---|
| Blood Glucose | ✓ | ✓ | Glucometer |
| Urine Glucose | ✓ | ✓ | Diastix |
| Serum Insulin | ✓ | ✓ | ELISA |
| Insulitis | x | ✓ | H&E Staining |
| Pancreatic Lymph Node Phenotyping | x | ✓ | Flow Cytometry |
| Serum Cytokines | x | ✓ | Meso Scale Discovery |
| Pancreatic Islet Phenotyping | ✓ | ✓ | qPCR/Simple Wes |
| Pancreatic B-Cell Apoptosis | ✓ | ✓ | TUNEL IHC |
| Diabetic Retinopathy | ✓ | x | Retinal Flat Mount Staining and Microscopy |
| Diabetic Nephropathy | ✓ | x | Urine ACR/Kidney Pathology |


Figure 1. STZ induces Type 1 Diabetes in C57BL/6J male mice. STZ-treated mice (n=8) exhibited higher blood glucose levels compared with vehicle-treated mice (n=4). *p<0.05; **p<0.01.
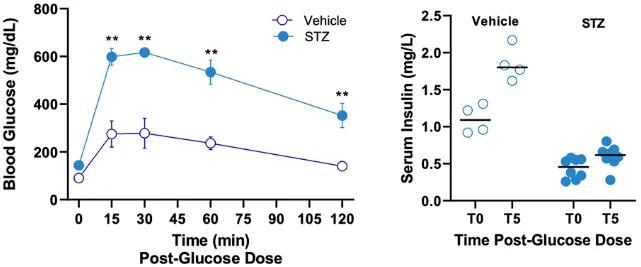
Figure 2. Oral glucose tolerance test and serum insulin assessment in STZ-induced Type 1 Diabetes mice. On study day 21, blood glucose levels were determined prior (T0) and after 15, 30, 60 and 120 min post-glucose administration in STZ-induced Type 1 Diabetes and non-diabetic control mice. STZ-treated mice exhibited higher blood glucose levels compared to vehicle-treated mice. ** p<0.01. Sera insulin was determined at 0 and 5 min post glucose administration. STZ-treated mice exhibited lower serum insulin values compared to vehicle- treated mice.


Figure 3. Diabetes Incidence. DIDS treatment decreases blood glucose levels and delays the onset of diabetes.

Figure 4. Blood Glucose. Treatment with anti-CD40L mAb in NOD/ShiLtJ female mice beginning at 8 weeks of age maintains normoglycemia and prevents onset of diabetes.